



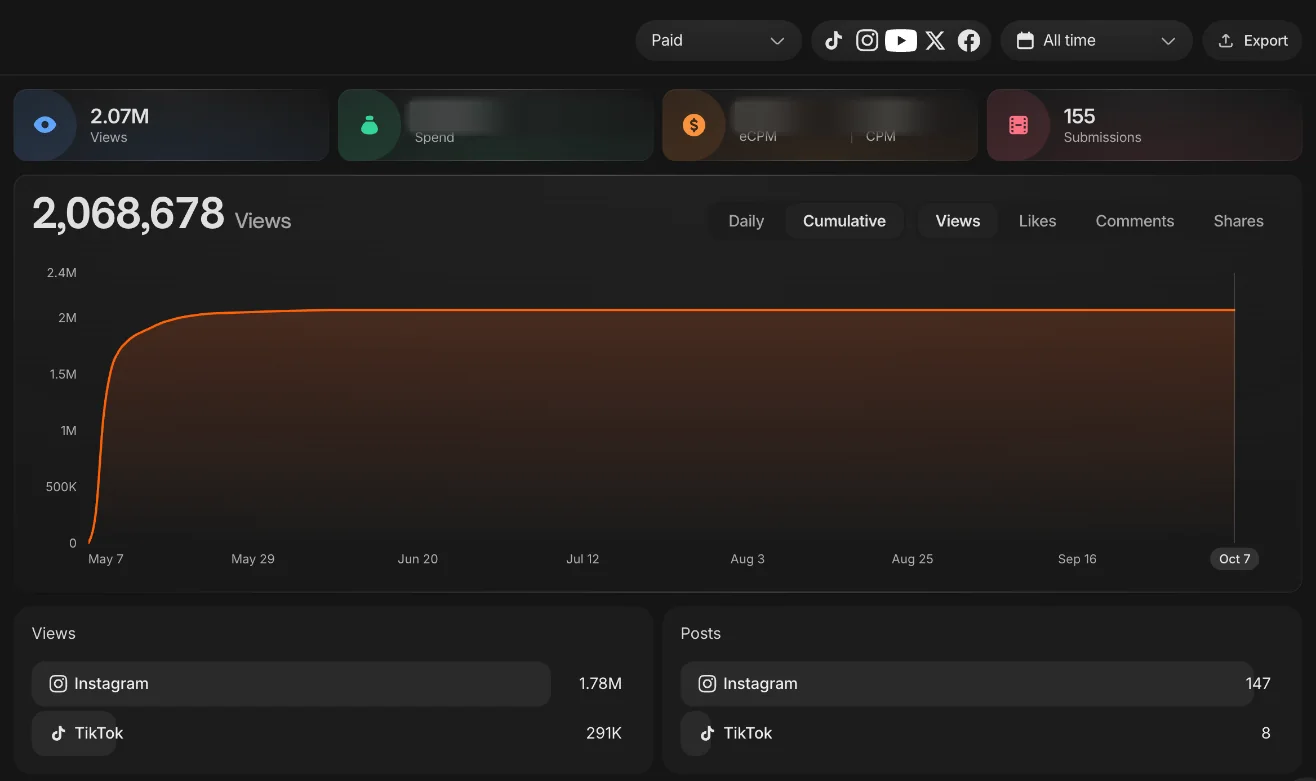
Evenson is an artist, and his "Trading Places" campaign asked clippers to cut the music video into short edits for TikTok and Instagram Reels. It began on May 7, 2026.
The campaign logged 2,068,678 verified views from 155 submissions, about 13,300 views per submission.
One music video, edited by many clippers
The brief was a single instruction: post edited clips from the "Trading Places" music video. Clippers chose the moments, the edits and the accounts.
The brief named TikTok, Instagram Reels and YouTube Shorts. In practice the posts landed on Reels and TikTok.
The campaign record
This campaign logged 2,068,678 views from 155 submissions on our Content Rewards dashboard.
| Campaign | Started | Views | Submissions | Views / submission |
|---|---|---|---|---|
| Evenson, "Trading Places"Instagram ReelsTikTok | May 7, 2026 | 2,068,678 | 155 | 13,346 |
Reels carried the volume
Clippers made 147 of the 155 submissions on Instagram Reels, and those posts drew about 1.78M views. That is roughly 12,100 per Reel and about 86% of the campaign total.
Only 8 submissions went to TikTok. They drew 291K views, about 36,400 each.
A 257K TikTok on day two
The biggest clip was a TikTok posted on May 9, two days after launch. It reached 257K views and 34K likes, a like rate of about 13%.
The next three clips were Reels at 208K, 103K and 102K views, all posted within the first two days. The four together drew about 32% of the campaign's views, so the rest came from the long tail of 151 other submissions.
What a small TikTok sample tells you
Eight TikTok posts is too few to rank the two platforms. Our read: with so few TikToks, the per-post average mostly reflects one 257K clip.
If you want a clean comparison, brief both platforms equally from day one. Our music clipping campaigns page explains how we run artist releases, and pricing covers typical delivery. The Disclosure case study shows another artist release. To plan one, book a call.
The top Evenson clips
| Platform | Posted | Views | Likes |
|---|---|---|---|
| TikTok | May 9, 2026 | 257K | 34K |
| Instagram Reels | May 8, 2026 | 208K | 431 |
| Instagram Reels | May 9, 2026 | 103K | 498 |
| Instagram Reels | May 9, 2026 | 102K | 204 |
Why it works
- Creator-led distribution opens multiple algorithm pathways at once.
- Creator distribution gives approved source material more creative interpretations and audience entry points than single-account posting.
- Weekly scale decisions turn campaign data into repeatable growth.