



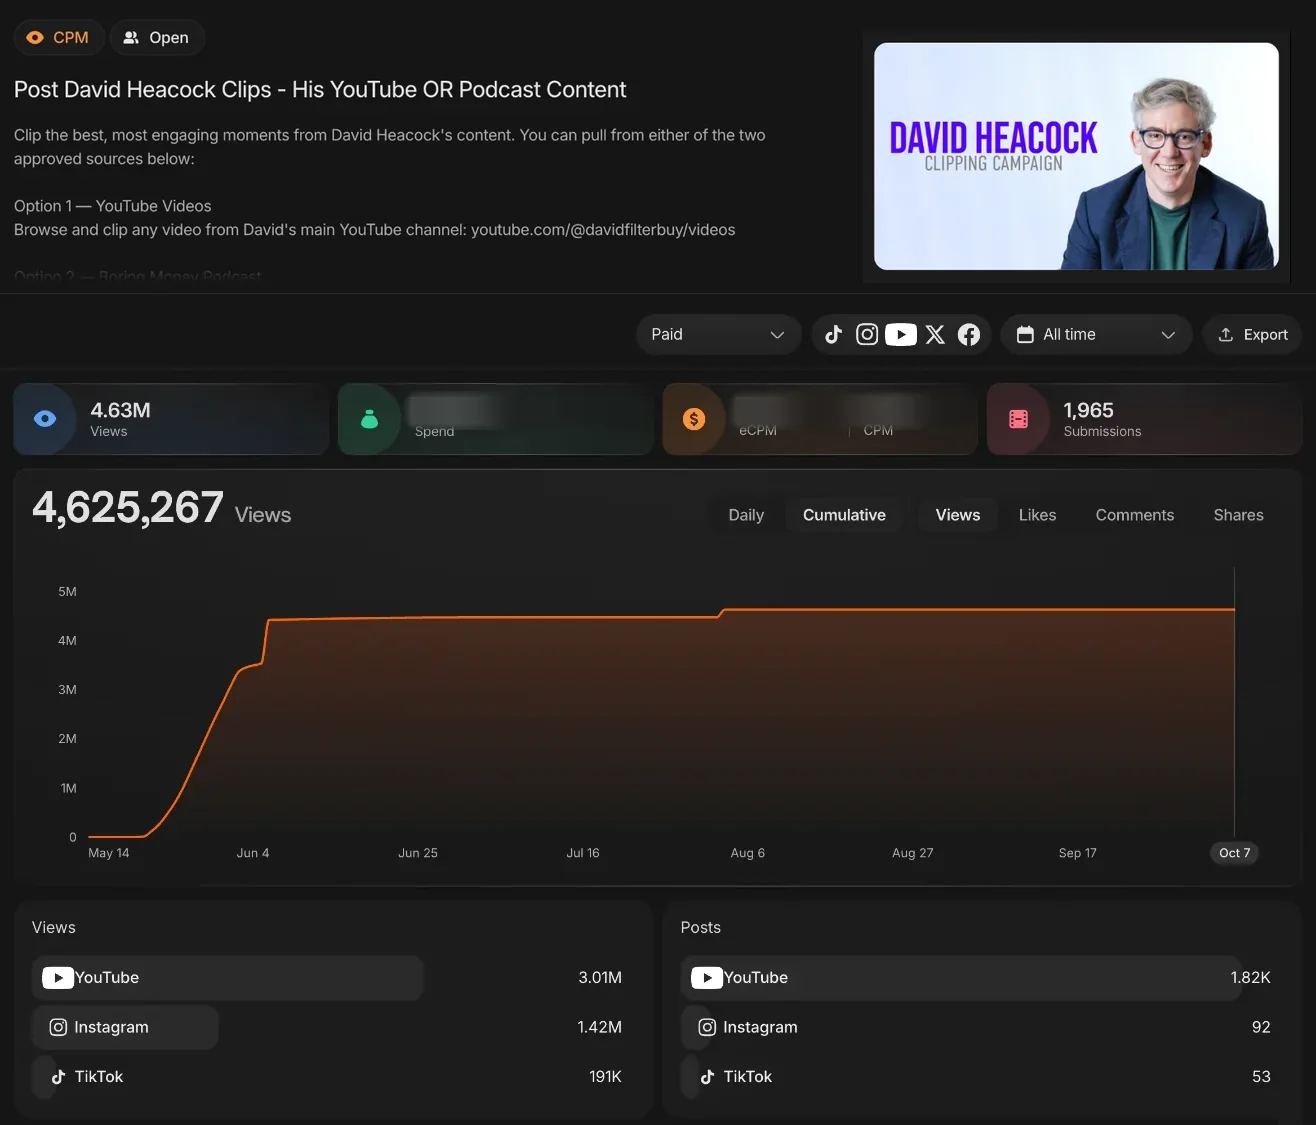
David Heacock publishes YouTube videos and a podcast. In May 2026 we opened a Content Rewards campaign. Clippers cut moments from either one and posted them to TikTok, Instagram Reels and YouTube Shorts.
The campaign logged 4,625,267 views from 1,965 submissions, about 2,350 views per submission.
A volume campaign with a wide brief
The brief asked clippers to find the best and most engaging moments across David Heacock's YouTube videos and his podcast. It did not point to one episode or one release.
The campaign started on May 14, 2026. It drew 1,965 submissions, with a small average per post.
The campaign record
This campaign logged 4,625,267 views from 1,965 submissions on our Content Rewards dashboard.
| Campaign | Started | Views | Submissions | Views / submission |
|---|---|---|---|---|
| David Heacock, YouTube and podcast clipsYouTube ShortsInstagram ReelsTikTok | May 14, 2026 | 4,625,267 | 1,965 | 2,354 |
YouTube Shorts took 93% of the posts
Clippers published 1,820 Shorts, 92 Reels and 53 TikToks. Shorts earned 3.01M views, about 65% of the total, at roughly 1,650 views per post.
Reels were rarer and stronger per post. Those 92 posts drew 1.42M views, about 15,400 each, and about 31% of all views from under 5% of the posts.
Views came from the long tail
The biggest clip was a Reel posted on May 24 with 58.5K views and 3.72K likes. That is 1.3% of the campaign, and the like rate was about 6.4%.
With the top clip at about one percent of the total, the 4.6M views came from thousands of small posts adding up. Steady posting produced this total.
When to run a volume brief
A creator with a back catalogue of videos and podcast episodes has plenty to cut from. Our read: for that kind of source, open the brief wide and expect a large number of modest clips.
The clipping campaigns page explains the formats we run. See pricing for typical delivery, or book a call.
The top David Heacock clips
| Platform | Posted | Views | Likes |
|---|---|---|---|
| Instagram Reels | May 24, 2026 | 58.5K | 3.72K |
Why it works
- Creator-led distribution opens multiple algorithm pathways at once.
- Creator distribution gives approved source material more creative interpretations and audience entry points than single-account posting.
- Weekly scale decisions turn campaign data into repeatable growth.